


Energy Storage Market for UAVs by Product and Geography - Forecast and Analysis 2022-2026
Energy Storage Market for UAVs by Product and Geography - Forecast and Analysis 2022-2026
The "Energy Storage Market for Unmanned Aerial Vehicles (UAVs) by Product and Geography - Forecast and Analysis 2022-2026" report has been added to Technavio's offering. The report predicts the market to witness an accelerating growth momentum at a CAGR of 17.97%. The market growth potential is anticipated to increase by USD 2.26 billion from 2021 to 2026. 41% of the market growth will originate from North America with the US emerging as the key revenue-generating economy in the region. Product innovation will facilitate the energy storage market for unmanned aerial vehicles (UAVs) growth in North America over the forecast period. Furthermore, the report highlights that market for UAVs remained resilient despite the pandemic.

Technavio has announced its latest market research report titled Energy Storage Market for Unmanned Aerial Vehicles (UAVs) by Product and Geography - Forecast and Analysis 2022-2026
Prominent Market Dynamics
Key Driver: The growing affordability and popularity of UAVs among hobbyists is one of the key drivers fueling the energy storage market growth for drones. Manufacturers are selling drones having identical functioning, leading to intense competition in the global UAV market. This is also driving down the cost of drones as manufacturers are striving to maintain or increase their market shares. The lowered costs of drones will further fuel the adoption of UAVs.
Key Trend: The use of artificial intelligence in autonomous UAVs is one of the key energy storage market trends for unmanned aerial vehicles (UAVs) supporting the market growth. The need to increase operational efficiency is leading to the introduction of AI in the global UAV market, which will lead to the growth of the global energy storage market for UAVs during the forecast period.
Key Challenge: SWaP and other network-based constraints is one of the challenges limiting the energy storage market growth for drones. It is challenging for developers to integrate more sensor modules onboard a UAV system and still adhere to the SWaP footprint of current propulsion systems. This, in turn, is hampering the growth of the energy storage market for drones.
Competitive Analysis
The energy storage market for unmanned aerial vehicles (UAVs) is fragmented and the vendors are deploying organic and inorganic growth strategies to compete in the market. The energy storage market for unmanned aerial vehicles (UAVs) forecast report offers in-depth insights into key vendor profiles. The profiles include information on the production, sustainability, and prospects of the leading companies.
The competitive scenario provided in the energy storage market for unmanned aerial vehicles (UAVs) report analyzes, evaluates, and positions companies based on various performance indicators. Some of the factors considered for this analysis include the financial performance of companies over the past few years, growth strategies, product innovations, new product launches, investments, growth in market share, etc.
Company Profiles
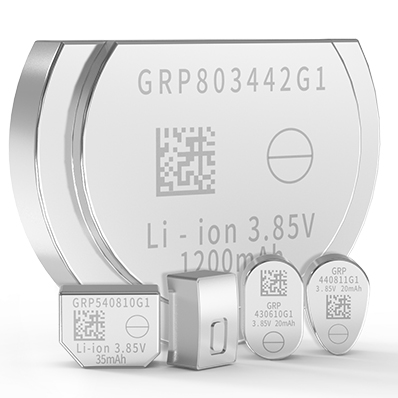
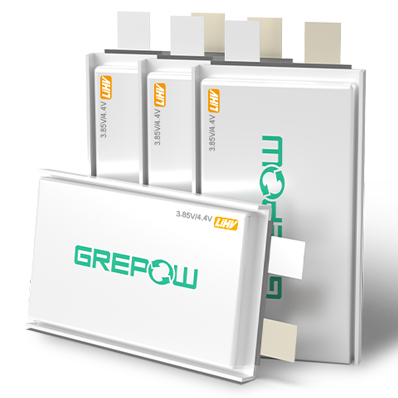
The energy storage market for UAVS report provides complete insights on key vendors including Ballard Power Systems Inc., Denchi Group Ltd., Doosan Corp., EaglePicher Technologies LLC, H3 Dynamics Holdings Pte. Ltd., Highpower International Inc., Hylium Industries Inc., Intelligent Energy Ltd., Kokam Co. Ltd., Lumenier, MicroMultiCopter Aviation, Shenzhen Grepow Battery Co. Ltd., Sion Power Corp., TotalEnergies SE, Vcanz Co. Ltd., Veken Technology Co. Ltd., and TDK Corp. Some of the companies are launching products and solutions to meet the evolving business requirements. For instance, Ballard Power Systems Inc. offers energy storage for unmanned aerial vehicles namely, BFD H2 multi-rotor UAV, powered by FCair 600 and FCair 1200 liquid-cooled fuel cell power systems, with built-in hybrid battery control and charging, and delivering 600 and 1200 watts of power, respectively. In addition, Denchi Group Ltd. offers energy storage for unmanned aerial vehicles namely, Sparrowhawk, which is designed for the need of lightweight and high power storage devices.
Revenue Generating Segmentation Highlights
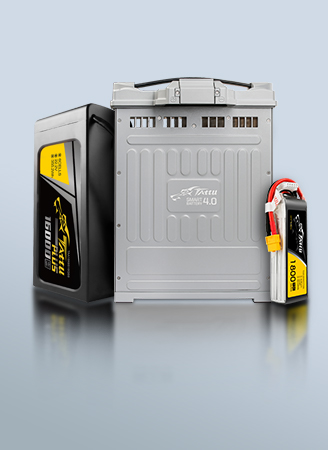
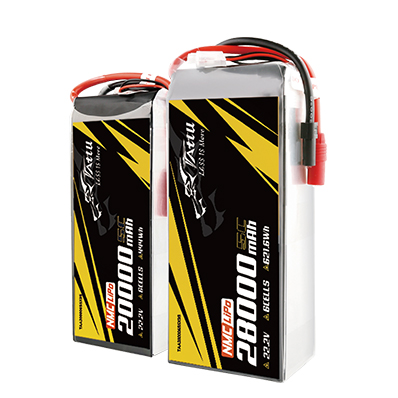
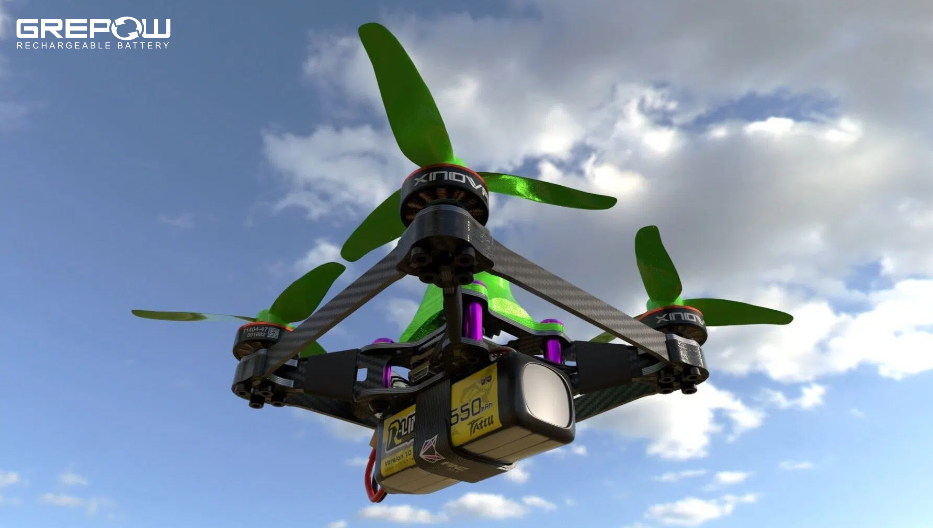
By Product, the market is classified into Battery and Fuel Cell. The battery segment held the largest energy storage market share for UAVs in 2021. The segment will continue to account for the highest share throughout the forecast period. The adoption rate of lithium-ion (Li-ion) and lithium-polymer (LiPo) batteries has increased due to the high demand for UAVs. Many small UAVs utilize high-density Li-ion or LiPo batteries for power. Such increasing demand for batteries will drive the energy storage for drones market during the forecast period.
Energy Storage Market For Unmanned Aerial Vehicles (UAVs) Scope
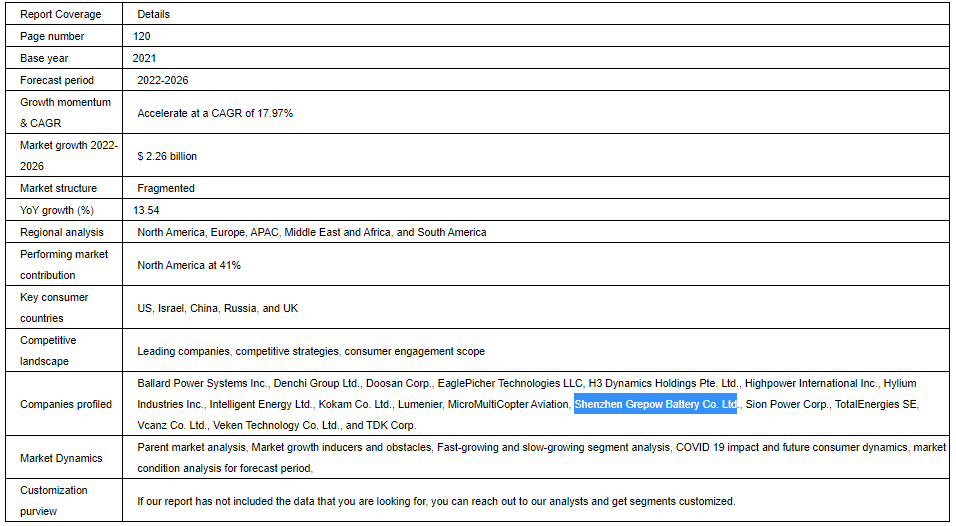
Report Coverage: Details
Page number: 120
Base year: 2021
Forecast period: 2022-2026
Growth momentum & CAGR: Accelerate at a CAGR of 17.97%
Market growth 2022-2026: $ 2.26 billion
Market structure: Fragmented
YoY growth (%): 13.54
Regional analysis: North America, Europe, APAC, Middle East and Africa, and South America
Performing market contribution: North America at 41%
Key consumer countries: US, Israel, China, Russia, and UK
Competitive landscape: Leading companies, competitive strategies, consumer engagement scope
Companies profiled:
Ballard Power Systems Inc., Denchi Group Ltd., Doosan Corp., EaglePicher Technologies LLC, H3 Dynamics Holdings Pte. Ltd., Highpower International Inc., Hylium Industries Inc., Intelligent Energy Ltd., Kokam Co. Ltd., Lumenier, MicroMultiCopter Aviation, Shenzhen Grepow Battery Co. Ltd., Sion Power Corp., TotalEnergies SE, Vcanz Co. Ltd., Veken Technology Co. Ltd., and TDK Corp.
Market Dynamics:
Parent market analysis, Market growth inducers and obstacles, Fast-growing and slow-growing segment analysis, COVID 19 impact and future consumer dynamics, market condition analysis for forecast period,
Customization purview:
If our report has not included the data that you are looking for, you can reach out to our analysts and get segments customized.
Table of Content
1 Executive Summary
1.1 Market overview
Exhibit 01: Executive Summary – Chart on Market Overview
Exhibit 02: Executive Summary – Data Table on Market Overview
Exhibit 03: Executive Summary – Chart on Global Market Characteristics
Exhibit 04: Executive Summary – Chart on Market by Geography
Exhibit 05: Executive Summary – Chart on Market Segmentation by Product
Exhibit 06: Executive Summary – Chart on Incremental Growth
Exhibit 07: Executive Summary – Data Table on Incremental Growth
Exhibit 08: Executive Summary – Chart on Vendor Market Positioning
2 Market Landscape
2.1 Market ecosystem
Exhibit 09: Parent market
Exhibit 10: Market Characteristics
3 Market Sizing
3.1 Market definition
Exhibit 11: Offerings of vendors included in the market definition
3.2 Market segment analysis
Exhibit 12: Market segments
3.3 Market size 2021
3.4 Market outlook: Forecast for 2021-2026
Exhibit 13: Chart on Global - Market size and forecast 2021-2026 ($ million)
Exhibit 14: Data Table on Global - Market size and forecast 2021-2026 ($ million)
Exhibit 15: Chart on Global Market: Year-over-year growth 2021-2026 (%)
Exhibit 16: Data Table on Global Market: Year-over-year growth 2021-2026 (%)
4 Five Forces Analysis
4.1 Five forces summary
Exhibit 17: Five forces analysis - Comparison between2021 and 2026
4.2 Bargaining power of buyers
Exhibit 18: Chart on Bargaining power of buyers – Impact of key factors 2021 and 2026
4.3 Bargaining power of suppliers
Exhibit 19: Bargaining power of suppliers – Impact of key factors in 2021 and 2026
4.4 Threat of new entrants
Exhibit 20: Threat of new entrants – Impact of key factors in 2021 and 2026
4.5 Threat of substitutes
Exhibit 21: Threat of substitutes – Impact of key factors in 2021 and 2026
4.6 Threat of rivalry
Exhibit 22: Threat of rivalry – Impact of key factors in 2021 and 2026
4.7 Market condition
Exhibit 23: Chart on Market condition - Five forces 2021 and 2026
5 Market Segmentation by Product
5.1 Market segments
Exhibit 24: Chart on Product - Market share 2021-2026 (%)
Exhibit 25: Data Table on Product - Market share 2021-2026 (%)
5.2 Comparison by Product
Exhibit 26: Chart on Comparison by Product
Exhibit 27: Data Table on Comparison by Product
5.3 Battery - Market size and forecast 2021-2026
Exhibit 28: Chart on Battery - Market size and forecast 2021-2026 ($ million)
Exhibit 29: Data Table on Battery - Market size and forecast 2021-2026 ($ million)
Exhibit 30: Chart on Battery - Year-over-year growth 2021-2026 (%)
Exhibit 31: Data Table on Battery - Year-over-year growth 2021-2026 (%)
5.4 Fuel cell - Market size and forecast 2021-2026
Exhibit 32: Chart on Fuel cell - Market size and forecast 2021-2026 ($ million)
Exhibit 33: Data Table on Fuel cell - Market size and forecast 2021-2026 ($ million)
Exhibit 34: Chart on Fuel cell - Year-over-year growth 2021-2026 (%)
Exhibit 35: Data Table on Fuel cell - Year-over-year growth 2021-2026 (%)
5.5 Market opportunity by Product
Exhibit 36: Market opportunity by Product ($ million)
6 Customer Landscape
6.1 Customer landscape overview
Exhibit 37: Analysis of price sensitivity, lifecycle, customer purchase basket, adoption rates, and purchase criteria
7 Geographic Landscape
7.1 Geographic segmentation
Exhibit 38: Chart on Market share by geography 2021-2026 (%)
Exhibit 39: Data Table on Market share by geography 2021-2026 (%)
7.2 Geographic comparison
Exhibit 40: Chart on Geographic comparison
Exhibit 41: Data Table on Geographic comparison
7.3 North America - Market size and forecast 2021-2026
Exhibit 42: Chart on North America - Market size and forecast 2021-2026 ($ million)
Exhibit 43: Data Table on North America - Market size and forecast 2021-2026 ($ million)
Exhibit 44: Chart on North America - Year-over-year growth 2021-2026 (%)
Exhibit 45: Data Table on North America - Year-over-year growth 2021-2026 (%)
7.4 Europe - Market size and forecast 2021-2026
Exhibit 46: Chart on Europe - Market size and forecast 2021-2026 ($ million)
Exhibit 47: Data Table on Europe - Market size and forecast 2021-2026 ($ million)
Exhibit 48: Chart on Europe - Year-over-year growth 2021-2026 (%)
Exhibit 49: Data Table on Europe - Year-over-year growth 2021-2026 (%)
7.5 APAC - Market size and forecast 2021-2026
Exhibit 50: Chart on APAC - Market size and forecast 2021-2026 ($ million)
Exhibit 51: Data Table on APAC - Market size and forecast 2021-2026 ($ million)
Exhibit 52: Chart on APAC - Year-over-year growth 2021-2026 (%)
Exhibit 53: Data Table on APAC - Year-over-year growth 2021-2026 (%)
7.6 Middle East and Africa - Market size and forecast 2021-2026
Exhibit 54: Chart on Middle East and Africa - Market size and forecast 2021-2026 ($ million)
Exhibit 55: Data Table on Middle East and Africa - Market size and forecast 2021-2026 ($ million)
Exhibit 56: Chart on Middle East and Africa - Year-over-year growth 2021-2026 (%)
Exhibit 57: Data Table on Middle East and Africa - Year-over-year growth 2021-2026 (%)
7.7 South America - Market size and forecast 2021-2026
Exhibit 58: Chart on South America - Market size and forecast 2021-2026 ($ million)
Exhibit 59: Data Table on South America - Market size and forecast 2021-2026 ($ million)
Exhibit 60: Chart on South America - Year-over-year growth 2021-2026 (%)
Exhibit 61: Data Table on South America - Year-over-year growth 2021-2026 (%)
7.8 US - Market size and forecast 2021-2026
Exhibit 62: Chart on US - Market size and forecast 2021-2026 ($ million)
Exhibit 63: Data Table on US - Market size and forecast 2021-2026 ($ million)
Exhibit 64: Chart on US - Year-over-year growth 2021-2026 (%)
Exhibit 65: Data Table on US - Year-over-year growth 2021-2026 (%)
7.9 China - Market size and forecast 2021-2026
Exhibit 66: Chart on China - Market size and forecast 2021-2026 ($ million)
Exhibit 67: Data Table on China - Market size and forecast 2021-2026 ($ million)
Exhibit 68: Chart on China - Year-over-year growth 2021-2026 (%)
Exhibit 69: Data Table on China - Year-over-year growth 2021-2026 (%)
7.10 Russia - Market size and forecast 2021-2026
Exhibit 70: Chart on Russia - Market size and forecast 2021-2026 ($ million)
Exhibit 71: Data Table on Russia - Market size and forecast 2021-2026 ($ million)
Exhibit 72: Chart on Russia - Year-over-year growth 2021-2026 (%)
Exhibit 73: Data Table on Russia - Year-over-year growth 2021-2026 (%)
7.11 UK - Market size and forecast 2021-2026
Exhibit 74: Chart on UK - Market size and forecast 2021-2026 ($ million)
Exhibit 75: Data Table on UK - Market size and forecast 2021-2026 ($ million)
Exhibit 76: Chart on UK - Year-over-year growth 2021-2026 (%)
Exhibit 77: Data Table on UK - Year-over-year growth 2021-2026 (%)
7.12 Israel - Market size and forecast 2021-2026
Exhibit 78: Chart on Israel - Market size and forecast 2021-2026 ($ million)
Exhibit 79: Data Table on Israel - Market size and forecast 2021-2026 ($ million)
Exhibit 80: Chart on Israel - Year-over-year growth 2021-2026 (%)
Exhibit 81: Data Table on Israel - Year-over-year growth 2021-2026 (%)
7.13 Market opportunity by geography
Exhibit 82: Market opportunity by geography ($ million)
8 Drivers, Challenges, and Trends
8.1 Market drivers
8.2 Market challenges
8.3 Impact of drivers and challenges
Exhibit 83: Impact of drivers and challenges in 2021 and 2026
8.4 Market trends
9 Vendor Landscape
9.1 Overview
9.2 Vendor landscape
Exhibit 84: Overview on Criticality of inputs and Factors of differentiation
9.3 Landscape disruption
Exhibit 85: Overview on factors of disruption
9.4 Industry risks
Exhibit 86: Impact of key risks on business
10 Vendor Analysis
10.1 Vendors covered
Exhibit 87: Vendors covered
10.2 Market positioning of vendors
Exhibit 88: Matrix on vendor position and classification
10.3 Ballard Power Systems Inc.
Exhibit 89: Ballard Power Systems Inc. - Overview
Exhibit 90: Ballard Power Systems Inc. - Business segments
Exhibit 91: Ballard Power Systems Inc. - Key news
Exhibit 92: Ballard Power Systems Inc. - Key offerings
Exhibit 93: Ballard Power Systems Inc. - Segment focus
10.4 Denchi Group Ltd.
Exhibit 94: Denchi Group Ltd. - Overview
Exhibit 95: Denchi Group Ltd. - Product / Service
Exhibit 96: Denchi Group Ltd. - Key offerings
10.5 Doosan Corp.
Exhibit 97: Doosan Corp. - Overview
Exhibit 98: Doosan Corp. - Business segments
Exhibit 99: Doosan Corp. - Key news
Exhibit 100: Doosan Corp. - Key offerings
Exhibit 101: Doosan Corp. - Segment focus
10.6 Highpower International Inc.
Exhibit 102: Highpower International Inc. - Overview
Exhibit 103: Highpower International Inc. - Product / Service
Exhibit 104: Highpower International Inc. - Key offerings
10.7 Intelligent Energy Ltd.
Exhibit 105: Intelligent Energy Ltd. - Overview
Exhibit 106: Intelligent Energy Ltd. - Product / Service
Exhibit 107: Intelligent Energy Ltd. - Key offerings
10.8 Kokam Co. Ltd.
Exhibit 108: Kokam Co. Ltd. - Overview
Exhibit 109: Kokam Co. Ltd. - Product / Service
Exhibit 110: Kokam Co. Ltd. - Key offerings
10.9 Sion Power Corp.
Exhibit 111: Sion Power Corp. - Overview
Exhibit 112: Sion Power Corp. - Product / Service
Exhibit 113: Sion Power Corp. - Key offerings
10.10 TDK Corp.
Exhibit 114: TDK Corp. - Overview
Exhibit 115: TDK Corp. - Business segments
Exhibit 116: TDK Corp. - Key news
Exhibit 117: TDK Corp. - Key offerings
Exhibit 118: TDK Corp. - Segment focus
10.11 TotalEnergies SE
Exhibit 119: TotalEnergies SE - Overview
Exhibit 120: TotalEnergies SE - Business segments
Exhibit 121: TotalEnergies SE - Key news
Exhibit 122: TotalEnergies SE - Key offerings
Exhibit 123: TotalEnergies SE - Segment focus
10.12 Veken Technology Co. Ltd.
Exhibit 124: Veken Technology Co. Ltd. - Overview
Exhibit 125: Veken Technology Co. Ltd. - Product / Service
Exhibit 126: Veken Technology Co. Ltd. - Key offerings
11 Appendix
11.1 Scope of the report
11.2 Inclusions and exclusions checklist
Exhibit 127: Inclusions checklist
Exhibit 128: Exclusions checklist
11.3 Currency conversion rates for US$
Exhibit 129: Currency conversion rates for US$
11.4 Research methodology
Exhibit 130: Research methodology
Exhibit 131: Validation techniques employed for market sizing
Exhibit 132: Information sources
11.5 List of abbreviations
Exhibit 133: List of abbreviations
About Technavio
Technavio is a leading global technology research and advisory company. Their research and analysis focus on emerging market trends and provides actionable insights to help businesses identify market opportunities and develop effective strategies to optimize their market positions. With over 500 specialized analysts, Technavio's report library consists of more than 17,000 reports and counting, covering 800 technologies, spanning across 50 countries. Their client base consists of enterprises of all sizes, including more than 100 Fortune 500 companies. This growing client base relies on Technavio's comprehensive coverage, extensive research, and actionable market insights to identify opportunities in existing and potential markets and assess their competitive positions within changing market scenarios.
SOURCE Technavio: Energy Storage Market for Unmanned Aerial Vehicles (UAVs) by Product and Geography - Forecast and Analysis 2022-2026


Related Articles
-
Building an FPV Drone: A Deep Dive into the Technology
2025-06-30 -

What is an 8S LiPo Battery?
2025-06-20 -

What Is the Voltage of a LiPo Battery?
2025-06-17
Related products
Comment(0)
Comment( Your email address will not be disclosed. Required fields are marked as * )